Tutorials and Tools
Keeping your research project information organized
In a research environment we typically use the term data to describe the various outcomes of running experiments. In the context of project management, the organization and communication of project related information is essential to successfully achieve a common understanding of progress and evaluation of results. From a project management perspective, it is important to distinguish such information into three main categories:
Work performance data are any collected data points from the execution process, it is very important to organize such data into a properly archived database (folders). The work performance information comprises all the data that are analyzed and put into context with the project objectives, and thus forms the key results of your project. Then all the collected information would be formulated into work performance reports that are typically shared with your PI and involved colleagues to show key progress and conclusions. In the context of scientific research projects, work performance data represent all direct outcomes of an experiments, i.e. the raw data files in addition to treated data, such as a plot of the absorption data collected of a sample by UV-Vis spectrophotometer or an XPS spectrum of a measured thin film. Then, the data from various samples and related experiments are analyzed and transformed into information showing comparisons and correlations in the context of certain parameters, such as showing the optical band gap changes in response to a changed control parameter or changes in atomic contents extracted from XPS spectra. Finally, the information from various experiments can be compiled into a "story telling" report, which forms the knowledge acquired from the project and key conclusion that satisfy the final objectives and requirements of the project or contribute to steering the direction of future work. The various processes and their outcomes in a scientific research project is illustrated in Figure 1. 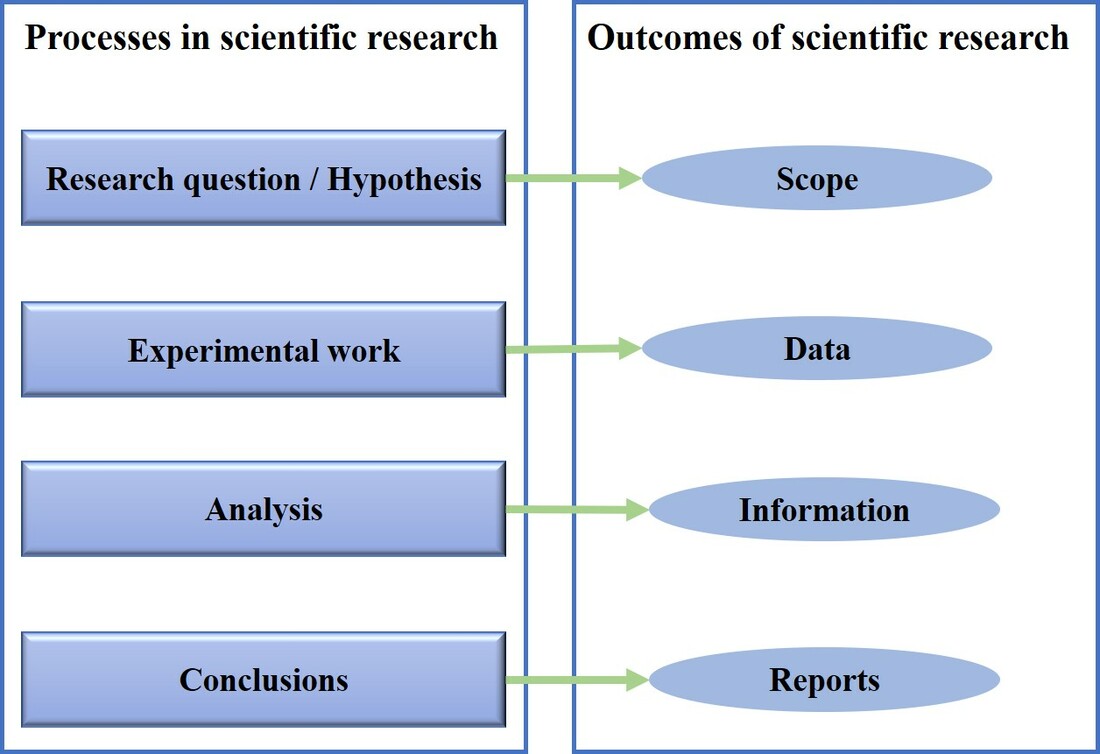
Figure 1: Processes in scientific research project and their outcomes.
It is of paramount importance to keep the project information properly organized and accessible once needed. The need of project information can arise during the reviewing process of a manuscript or potentially years after publishing a work, as most journals nowadays require making the raw data of experiments available for the public. [1-3]
In the following, I will be outlining a general procedure that proved to be helpful in accessing all project related information over the past years. Living in the current world of digitized information and computerized systems, it makes sense to use the simple tools available in hand from common operating systems we have in our electronic devices. A general standard process that I have personally adopted during my graduate studies and postdoc appointment, is to create a folder in my computer (or dropbox) titled as research. Here all items of my research related work are included. Then, subfolders that categorize (level 1) the various stages of a scientist activities can be created. For example, these could be: (1) PhD work, (2) Postdoc at institute A, (3) Postdoc at institute B, (4) Visiting professor at X, and so on as illustrated in Figure 2. Another way could also be to have a yearly categorized subfolder. This way of categorization should help in reaching out to project information easily in the future, since we tend to clearly remember the projects that we worked on a specific appointment or career stage. 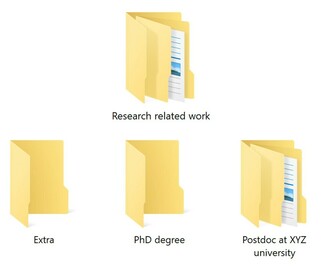
Figure 2: Level one categorization of project related information
The next step (level 2) is to create subfolders within each of these categories with the title indicating the project. For example, “Doping of A with the molecule B”, “Investigating the role of parameter X on the behavior of material A” and so on. In addition, an extra folder for minor work you contribute to other projects, in which you have run a single experiment on behalf of someone else could be created, that should be also sub-categorized into other folders clearly indicating the project.
To move further into the organization of you project information, each project folder should contain three main subfolders (level 3), for each category of the project information outlined above:
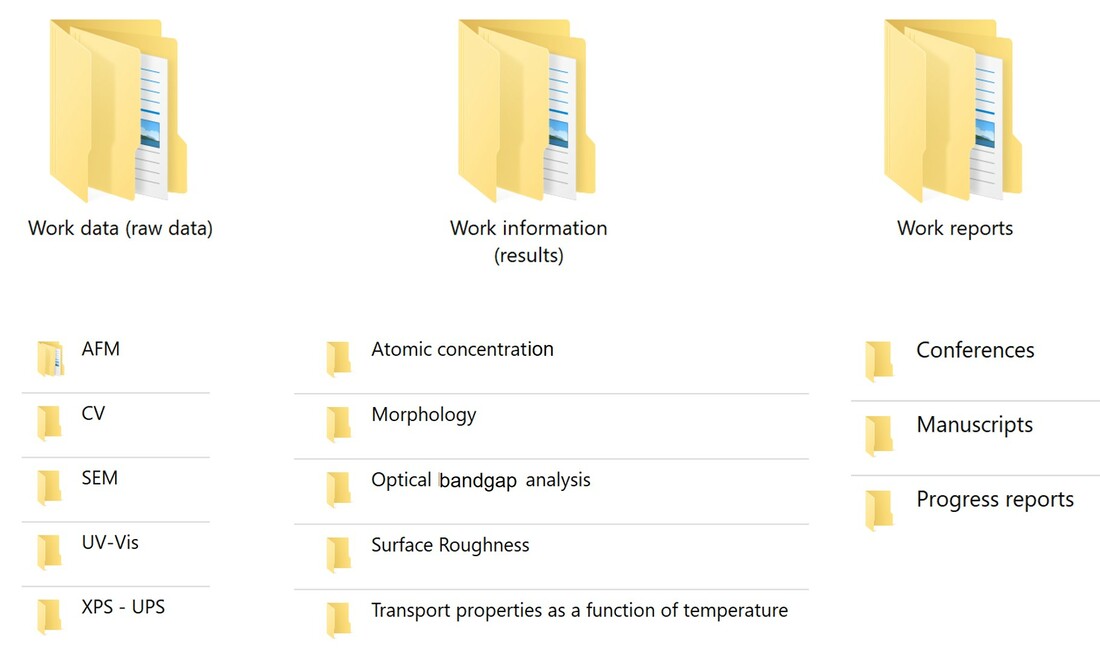
Figure 3: Level three and four categorization of project related information
Work performance data I found that the best way of dividing this folder in terms of easier accessibility is to create a folder for each experimental technique that generates raw data relevant to the project. Then each of these folders is populated with the raw data in subfolders with dates or months. Always remember to transform the raw data into a format that will be always accessible for you and others i.e. text files or excel sheets, while of course keeping the actual raw files of the extension of vendor-supplied software in the same folder. This is very important because the software license is typically provided for institutions and not for personal use. Thus, if you leave your institution you will cease to have access to such software, the raw files will not be accessible to you. In the case where raw data is treated, for example with background subtraction or normalization, name the files accordingly in an additional copy. It is a good practice to always keep the untreated data available and accessible for future examination or recalculation. Another practice related to this, is when analyzing your data into information in common software such as Origin or Excel, export of the untreated data, and then duplicate before any further treatment. This way, two sheets will be available which are the raw data sheet and treated data sheet. Work performance information Here, all analyzed data in the form of plots or tables should be included. Typically, this will be in the form of Excel sheets, Origin files or peak fitting software files such as CasaXPS or WinSpec. The objective of this folder is you can easily identify and access and information you have created, modify the format in addition to adding new data acquired later. Thus, it is important to assure that the title of each of these files clearly reflects what it includes. In general, the categorization here will be reflecting the properties or parameters studied rather than instrument based as in the work performance data. For example, electrical conductivity changes with parameter A, band gap of doped polymer, XPS peak fitting of the sulfur peak or the efficiency of solar cells as a function of electrode material. Work performance report In this folder, the project information put into context of the project findings and conclusions are included. A work performance report is any presentable form of project information that you could share with your peers, and potentially publish. Contents of the project performance information are compiled together into a coherent set of results, discussion and conclusions. Suggested subfolders to further organize this area are as follows: (1) Conferences abstracts and presentations, (2) group meeting presentations, (3) Progress report presentations and (4) Manuscripts. Let me know your thoughts in the comments section below, and perhaps share your way of organizing your project related information. References: [1] D. G. Roche, Science 357, Issue 6352, pp. 654 (2017) [2] C. J. Savage, A. J. Vickers, PLOS ONE 4, e7078 (2009) [3] https://www.nature.com/sdata/policies/data-policies |
Contents:
|
